Reading the Skew: How Options Volatility Distortions Signal Trades That Standard Charts Will Never Show You
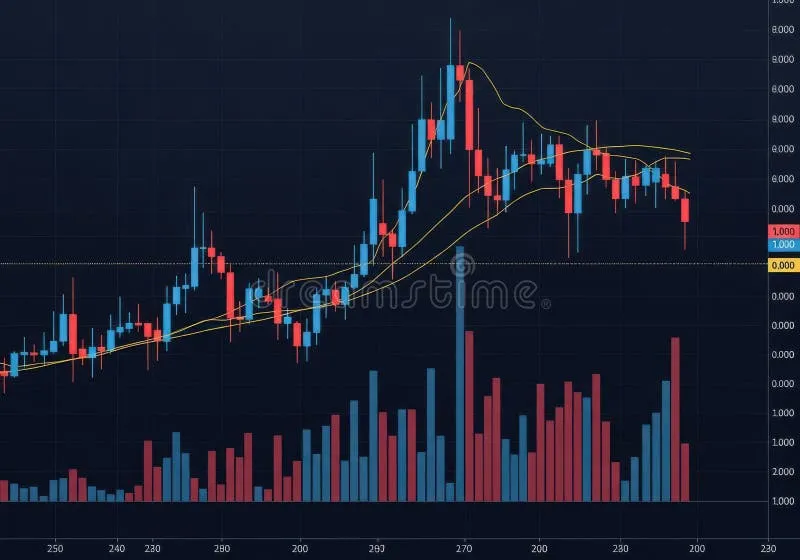
Photo: options trading volatility chart data screen financial analyst, via thumbs.dreamstime.com
Volatility skew is one of the most information-dense signals available to the active options trader, yet it remains largely invisible to participants who confine their analysis to price charts and technical indicators. When the market prices downside protection at a steep premium to equivalent upside exposure, it is communicating something specific about collective fear, positioning, and the asymmetric distribution of expected outcomes—and that communication creates exploitable edges for traders who know how to interpret it.
What Skew Actually Measures
In a theoretically efficient options market, calls and puts equidistant from the current price would carry identical implied volatility. Reality diverges from this symmetry in persistent and meaningful ways. The implied volatility surface—the three-dimensional map of how option prices vary across strikes and expirations—is rarely flat. Typically, out-of-the-money puts on equity indices trade at materially higher implied volatility than equivalent calls, a phenomenon known as negative skew or the volatility smile.
This asymmetry reflects something more than pure mathematics. It encodes the aggregate demand for downside protection, the memory of historical tail events, the positioning of institutional hedgers, and the behavioral tendency of market participants to overweight catastrophic outcomes relative to equivalent positive surprises. For the active trader, each of these components is a data point—not merely about pricing, but about the psychological and structural state of the market itself.
Skew is commonly measured by comparing the implied volatility of 25-delta puts to 25-delta calls for a given expiration. A wide spread indicates elevated demand for downside protection; a narrow spread—or in unusual circumstances, a positive skew favoring calls—signals something structurally different about how participants are positioned.
Why Retail Traders Systematically Overlook It
The persistence of skew as an exploitable signal owes much to the cognitive habits of retail market participants. Standard technical analysis—moving averages, relative strength indicators, volume profiles—operates entirely within the price dimension. It is inherently backward-looking and agnostic about the distribution of future outcomes. Options skew, by contrast, is forward-looking and explicitly probabilistic. It requires a different analytical framework, one that most retail traders have not been trained to apply.
There is also a practical barrier. Accessing reliable implied volatility data across strikes and expirations requires either a sophisticated brokerage platform or a dedicated data subscription. Many retail traders operate with tools that display only a single implied volatility figure—typically the at-the-money estimate—which strips out precisely the cross-strike variation that makes skew analysis valuable.
This informational gap is, for the prepared trader, an opportunity.
Earnings Season: Where Skew Distortions Are Most Actionable
The quarterly earnings cycle in US equity markets creates recurring and predictable skew distortions that reward systematic analysis. In the weeks preceding a major earnings release, implied volatility across the term structure typically rises as traders purchase options to express directional views or hedge existing positions. The shape of the skew during this period reveals the market's aggregate expectation about the direction and magnitude of the anticipated move.
When put skew is unusually steep heading into an earnings announcement—when out-of-the-money puts are priced at a significant premium relative to historical norms—it often indicates that institutional participants are aggressively hedging long equity exposure rather than expressing genuine bearish conviction. This distinction matters. Hedging demand inflates put prices beyond their fair value as directional instruments, creating an overpriced insurance market that can be exploited by sellers of that protection.
Conversely, when pre-earnings skew is unusually flat or tilted toward calls, it may signal that the market is anticipating a positive surprise with insufficient skepticism—a setup that historically has preceded sharper-than-expected post-earnings declines, not because the results were necessarily poor, but because the absence of protective positioning amplified the selling response to any disappointment.
A practical framework involves comparing current skew levels to the historical distribution for the same name across prior earnings cycles. Significant deviations from that historical baseline—either in magnitude or direction—represent the most actionable setups.
Policy Uncertainty and the Macro Skew Signal
Beyond individual equities, volatility skew in index options—particularly on the S&P 500—serves as a real-time barometer of macro-level uncertainty. During periods of elevated policy ambiguity, such as Federal Reserve meeting cycles, debt ceiling negotiations, or geopolitical escalations, skew tends to steepen as institutional participants seek portfolio-level protection.
The critical distinction for active traders is between skew that reflects genuine uncertainty about outcomes and skew that reflects mechanical hedging by participants who are structurally compelled to buy protection regardless of their actual outlook. Pension funds, for example, are required by mandate to hedge equity exposure beyond certain drawdown thresholds. Their demand for index puts is not a market forecast; it is a compliance obligation. When their hedging activity is the primary driver of elevated skew, the resulting pricing distortion can be exploited by traders willing to sell that protection and manage the resulting risk dynamically.
The VIX term structure—the relationship between near-term and longer-dated implied volatility—provides complementary context. When the term structure is inverted, with near-term implied volatility exceeding longer-dated levels, it typically indicates acute short-term anxiety that is expected to resolve. This configuration often precedes rapid skew compression once the catalyzing uncertainty event passes, creating opportunities for traders positioned to benefit from that normalization.
Sector Rotation and Skew Divergence
Perhaps the least discussed application of skew analysis involves cross-sector divergence. When skew in one sector diverges materially from its historical relationship with a correlated sector, it signals an asymmetric positioning dynamic that may not yet be visible in price action.
Consider a scenario in which technology sector put skew is elevated while financial sector skew remains subdued, despite both sectors being sensitive to interest rate expectations. This divergence suggests that institutional participants are more concerned about downside in technology than their current price exposure implies—a structural overhang that can weigh on the sector's ability to rally even in the absence of obvious negative catalysts.
For the active trader, this kind of cross-sector skew analysis functions as a leading indicator of rotation dynamics. Capital tends to flow away from structurally over-hedged sectors and toward those where the risk-reward balance is more favorable—and the skew surface often reflects this reallocation before price action confirms it.
Building a Practical Skew Framework
Implementing skew analysis does not require exotic instruments or institutional infrastructure. Several practical entry points are accessible to active retail traders operating through standard US brokerage platforms.
Begin by establishing baseline skew profiles for the instruments you trade most frequently. Track the 25-delta put-call skew across multiple expirations over several months to develop a sense of what constitutes normal, elevated, and suppressed skew for each name. Context is essential; a skew level that is extreme for a large-cap consumer staple may be unremarkable for a high-beta semiconductor stock.
Use skew as a filter rather than a standalone signal. A directional view supported by technical or fundamental analysis becomes considerably more compelling when skew confirms the positioning setup. A bullish thesis on a stock where put skew is collapsing—indicating that institutional hedgers are unwinding protection—carries a meaningfully different risk profile than the same thesis entered when skew is expanding.
Finally, treat skew changes as dynamic information. A skew that was elevated yesterday and is compressing today is telling you something about how institutional positioning is evolving in real time. That evolution is often more informative than the static level at any single point.
The Informational Edge in Plain Sight
Volatility skew will not appear on a candlestick chart. It will not generate a moving average crossover signal. It requires a deliberate shift in analytical framework—from the language of price to the language of probability and positioning. For the active trader willing to make that shift, the skew surface offers a window into market structure that the majority of participants will never see.
The edge, as always, belongs to those who look where others do not.