When Volume Lies: Decoding the Order Flow Signals That Precede Market Dislocations
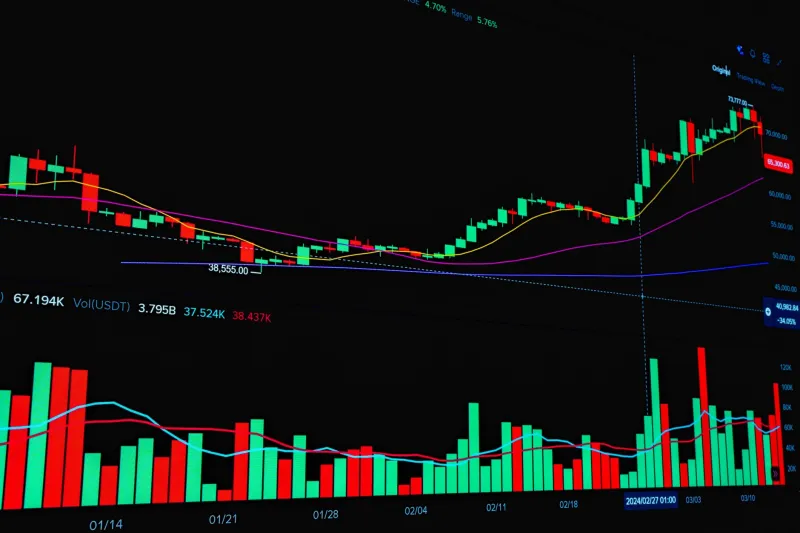
Volume is routinely cited as the market's lie detector — the metric that confirms whether a price move carries conviction or is simply noise. For decades, technical traders have operated under the assumption that rising prices accompanied by rising volume signal healthy accumulation, while price declines on heavy volume indicate genuine distribution. The problem is that this framework, while useful in stable regimes, can be weaponized against the unprepared trader during periods of acute market stress.
The volume spike that appears to validate a breakout may, in fact, be the final exhaust of institutional liquidation before a sharp reversal. Recognizing the difference between these two scenarios is not merely an academic exercise — it is the distinction between entering a trade at the right moment and absorbing the losses that sophisticated participants are actively offloading.
The Anatomy of a Manufactured Breakout
To understand why volume misleads, it is necessary to examine the mechanics of how large positions are unwound in modern equity and futures markets. Institutional desks managing multi-billion-dollar books cannot simply sell into a declining market without accelerating their own losses. Instead, coordinated exits frequently occur during periods of engineered upside momentum — moments when retail participation is highest and liquidity appears abundant.
The process typically unfolds in stages. First, a catalyst — whether a Federal Reserve statement, an earnings surprise, or a geopolitical development — generates genuine buying interest. Prices rise, volume increases, and the move appears legitimate. Algorithmic strategies that track momentum pile in, further amplifying the advance. It is at precisely this point that informed sellers begin distributing inventory into the enthusiasm.
The result is a volume profile that, when viewed on a standard chart, resembles confirmation of a trend continuation. In reality, the market is experiencing a transfer of ownership from sophisticated to less-informed participants. The breakout is real in price terms but hollow in terms of underlying demand.
Case Study: The February 2018 Volatility Implosion
Few episodes in recent market history illustrate this dynamic as clearly as the volatility collapse of early February 2018. The S&P 500 had extended a remarkably low-volatility advance through January, and trading volume in both equity index ETFs and VIX-linked products was elevated throughout the final days of that rally.
For traders watching the tape in real time, several anomalies were present. First, despite the heavy volume in instruments like SPY and QQQ, the advance lacked the broad participation typically associated with sustainable institutional accumulation. Second, options flow data showed a meaningful divergence between surface-level bullish sentiment and the actual positioning of large-money traders, who were quietly building protective structures. Third, the VIX itself was behaving erratically relative to realized volatility — a classic signal that the market's risk-pricing mechanism was under stress.
When the reversal arrived in the first week of February, it was swift and severe. Traders who had interpreted the preceding volume surge as confirmation of trend strength were caught fully exposed. Those who had examined the order flow beneath the headline numbers had reduced exposure or established hedges before the dislocation.
Technical Signatures of False Accumulation
Several measurable patterns tend to precede these events, and active traders who incorporate them into their analysis gain a meaningful informational edge.
Divergence between price and market breadth. When an index advances on heavy volume but the percentage of constituent stocks participating in the move narrows sharply, the volume is concentrated rather than broad-based. This narrowing is a warning sign that the advance is being driven by a small number of heavily-weighted names — often the very positions institutional sellers are most eager to distribute.
Anomalous options activity. Large put purchases or unusual spread structures in index options, occurring simultaneously with surface-level bullish price action, frequently indicate that sophisticated participants are hedging against a move they anticipate is imminent. Monitoring the CBOE's published flow data and tracking unusual options activity through publicly available tools provides a useful cross-reference.
Tape speed and order size distribution. During genuine accumulation, order flow tends to be deliberate — characterized by consistent bid-side participation and relatively uniform transaction sizes. During coordinated liquidation events, the tape often shows a mix of large block prints on the offer side interspersed with smaller retail orders on the bid. Platforms that provide time-and-sales data with sufficient granularity allow traders to observe this imbalance directly.
Volume at price concentration near resistance. When the bulk of a session's volume clusters at or just above a well-defined technical resistance level, it often indicates that sellers are using that level as a benchmark for distribution rather than buyers absorbing supply to push through it. This is particularly evident in futures markets, where the Commitment of Traders report provides a lagged but informative picture of positioning among commercial and non-commercial participants.
Building a Pre-Dislocation Checklist
For the active trader seeking a structured approach, the following diagnostic framework provides a starting point for assessing whether a volume spike represents genuine accumulation or a distribution event in progress.
First, assess market breadth across multiple timeframes. A volume surge accompanied by declining advance-decline ratios or weakening new-high lists is suspect regardless of headline price performance.
Second, cross-reference options flow against price action. Significant put-buying or collar structures appearing during a price advance warrant closer scrutiny of the underlying order flow.
Third, examine the relationship between volume and price efficiency. Genuine accumulation tends to produce relatively smooth price advances with limited intraday reversals. Heavy volume combined with wide intraday ranges and frequent directional reversals is characteristic of a market in which supply and demand are more evenly contested than the closing price suggests.
Fourth, monitor credit markets and interest rate futures for divergence. Equity volume spikes that occur while credit spreads are widening or Treasury yields are moving in a risk-off direction deserve particular skepticism.
The Informed Trader's Advantage
Market dislocations do not announce themselves in advance, and no analytical framework eliminates the possibility of loss. What disciplined order flow analysis does provide is a probabilistic edge — a means of identifying when the risk-reward calculus has shifted unfavorably before that shift becomes apparent to the broader market.
The traders who navigated episodes like the March 2020 pandemic selloff, the 2022 rate shock, and the August 2024 carry trade unwind with the least damage were not those who predicted the precise timing of the break. They were the traders who recognized, through careful observation of volume character and order flow dynamics, that the conditions supporting the preceding advance had quietly deteriorated.
Reading the tape is a skill that requires practice, the right data infrastructure, and the intellectual honesty to act on what the market is actually communicating rather than what one hopes it is saying. In the current environment — where algorithmic participants can amplify both genuine and manufactured moves with equal efficiency — that skill is more valuable than at any previous point in market history.