Phantom Depth: How Micro-Cap Liquidity Illusions Trap Retail Traders at the Exit

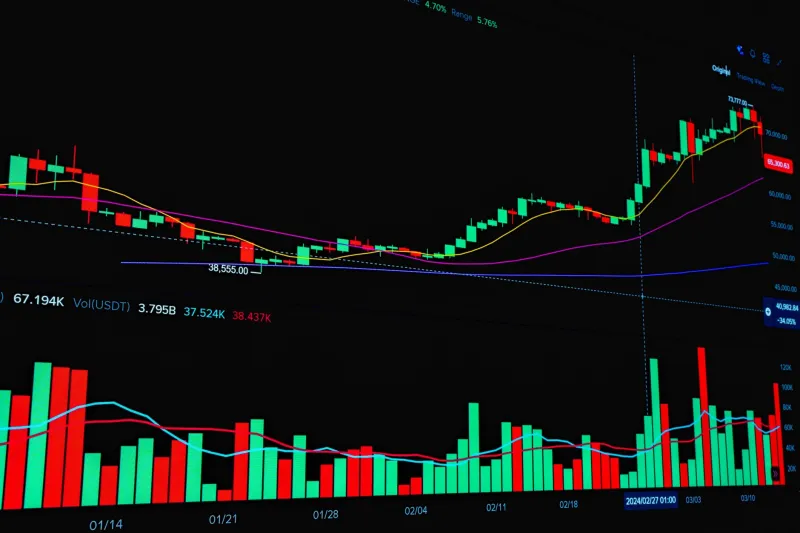
Photo: forextime.com, CC BY 2.0, via Wikimedia Commons
There is a particular cruelty embedded in the micro-cap trading ecosystem. The same thin order books that allow a security to double on modest volume will, with equal efficiency, destroy a position the moment a trader attempts to exit at size. For active traders operating in lower-capitalization equities, the gap between perceived liquidity and actual liquidity is not a minor inconvenience — it is a portfolio-level risk that demands systematic analysis before any position is initiated.
The Anatomy of a Liquidity Mirage
Liquidity, at its most basic level, is the ability to transact at or near the prevailing market price without materially moving that price. In large-cap equities trading on the NYSE or Nasdaq with millions of shares changing hands daily, this definition holds reasonably well. In micro-cap securities — broadly defined as companies with market capitalizations below $300 million — the definition becomes dangerously theoretical.
Consider what occurs during a typical micro-cap breakout. A stock trading at $2.40 with average daily volume of 180,000 shares suddenly prints 1.2 million shares over two sessions and pushes through a well-publicized technical resistance level at $2.75. Retail traders scanning for volume surges identify the pattern and enter, interpreting the elevated volume as evidence of institutional interest and, by extension, liquidity depth.
The interpretation is frequently wrong on both counts.
Elevated volume in micro-cap securities does not reliably indicate institutional accumulation. It often reflects a confluence of algorithmic momentum strategies, retail FOMO, and in some documented cases, coordinated wash trading designed to simulate organic interest. The critical distinction lies not in volume alone but in the composition of that volume — a variable that standard retail trading platforms are poorly equipped to reveal.
Bid-Ask Spread Behavior During Apparent Breakouts
One of the more counterintuitive phenomena in micro-cap trading is the tendency for bid-ask spreads to widen precisely during what appear to be the most bullish moments. When a stock is consolidating near support, market makers are often willing to quote tight spreads because two-sided flow is predictable. During a breakout, however, the order flow becomes unidirectional. Market makers, recognizing the adverse selection risk of being on the wrong side of an informed order, respond by widening spreads and pulling depth from the order book.
A useful historical illustration involves the class of small biotech and cannabis-adjacent equities that experienced violent rallies between 2020 and 2021. Numerous securities in this cohort saw Level 2 order books that appeared robust at the moment of breakout — five or six market makers quoting within a two-cent spread — only to show a dramatically different picture thirty minutes into the move. Spreads that opened at $0.03 widened to $0.15 or beyond, and bid depth at key price levels evaporated entirely. Traders who entered on the initial breakout candle found themselves holding positions they could only exit at a 4-6% discount to the last printed price.
This is not a malfunction. It is the market operating exactly as designed, pricing in the uncertainty that elevated directional momentum creates.
Distinguishing Institutional Accumulation from Algorithmic Wash Activity
The practical challenge for the active trader is developing a reliable methodology for separating genuine buying interest from manufactured volume. Several indicators, used in combination, provide meaningful signal.
Time-and-Sales Granularity. Authentic institutional accumulation tends to manifest in irregular trade sizes — partial fills at varying price levels that reflect a large order being worked into the market over time. Wash trading and algorithmic momentum activity, by contrast, often produces suspiciously regular trade sizes, frequently clustering around round numbers (500 shares, 1,000 shares) executed in rapid succession.
Dark Pool Prints. Legitimate institutional interest in a micro-cap name will occasionally surface through off-exchange prints reported to FINRA's trade reporting facilities. While dark pool data is imperfect, a pattern of sizable off-exchange prints preceding a price move is a more credible signal of real accumulation than pure on-exchange volume spikes.
Relative Volume Context. A volume surge that is 10x the 30-day average is far less meaningful if that average is 50,000 shares per day. The absolute share count matters. A stock printing 500,000 shares on a day when its typical volume is 50,000 may feel like enormous interest, but that volume figure is still insufficient to absorb a position of any meaningful dollar size without significant slippage.
Short Interest and Borrow Availability. Stocks with elevated short interest and constrained borrow availability are particularly prone to manufactured squeezes that lack fundamental staying power. When the rally is driven primarily by short covering rather than new long demand, the exit window closes the moment covering is complete.
A Framework for Evaluating Sustainable Exit Windows
Before entering any micro-cap setup, the disciplined trader should conduct what might be called an exit-first analysis — a deliberate assessment of how and at what cost the position can be unwound before considering whether to enter at all.
The framework involves four sequential questions:
-
What is the realistic daily dollar volume? Multiply average daily share volume by the average price to arrive at a dollar volume figure. A reasonable rule of thumb is that a single position should not exceed 5-10% of a security's average daily dollar volume if the trader expects to exit within a standard holding period.
-
What is the spread cost as a percentage of expected move? If a stock trades with a $0.10 spread and the anticipated move is $0.40, the round-trip spread cost consumes 50% of the expected gain before any other friction is considered. This math disqualifies many apparent setups outright.
-
Is there a catalyst with a defined timeline? Micro-cap setups supported by a specific, time-bounded catalyst — a regulatory decision, an earnings announcement, a contract award — tend to maintain liquidity more consistently than momentum-only plays, because the catalyst creates a shared reference point for both buyers and sellers.
-
What does the order book look like at multiple price levels above entry? Examining depth not just at the current price but at the anticipated exit targets reveals whether the liquidity visible at entry will persist through the move. Thin depth at exit levels is a direct warning that slippage will erode returns.
The Discipline That Separates Precision Traders from Momentum Chasers
Micro-cap trading is not inherently unsuitable for the active trader. Certain setups in this space offer genuine asymmetric return potential that is unavailable in larger, more efficiently priced securities. The distinction between traders who profit consistently from this space and those who suffer repeated exit failures is not superior stock selection — it is superior liquidity analysis conducted before capital is deployed.
The market does not reward enthusiasm for a chart pattern. It rewards the trader who has already mapped the exit before stepping through the entrance. In micro-cap equities, that discipline is not optional. It is the only durable edge available.